OpenWeatherMap forecast on LCD with Raspberry Pi, Java and Pi4J
Pi4J contains helper methods to minimize the work needed to use certain hardware modules on the Pi with Java. As an example, we will be using “GpioLcdDisplay” to control an LCD with 2 rows of 16 characters. After requesting the weather forecast from a public website, we will visualize this on the LCD display.
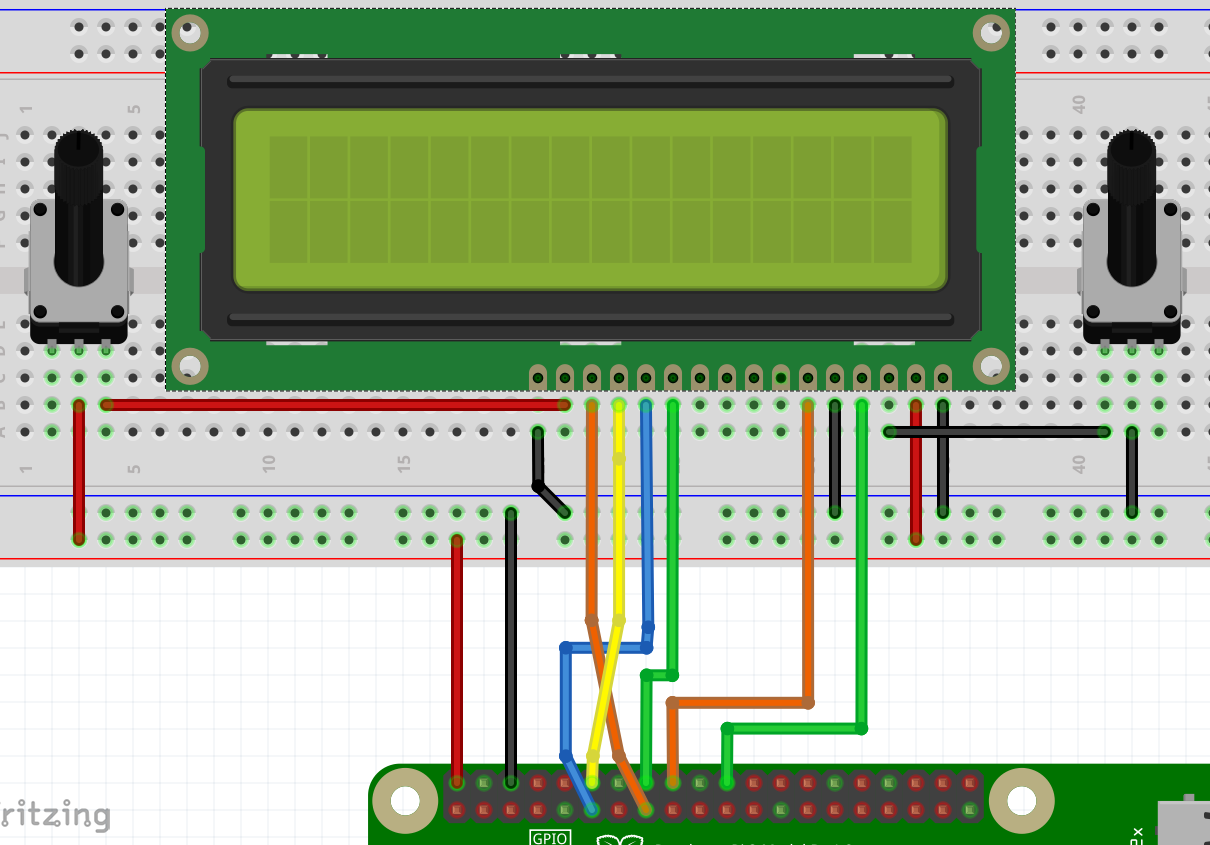
Wiring
Not all these types of displays have completely the same connections, so you’ll need to check your display to setup the wiring like this:
- VSS: ground
- VDD: 5V
- V0: with variable resistor (potentiometer) connected to ground. Used to control the brightness of the characters. I you don’t have such one, you can experiment with different resistors to find the best one for maximum readability.
- RS, E, D4, D5, D6 and D7: to GPIO as defined in the code
- RW: ground. Blocks sending back data to the board as we don’t want to have 5V being sent to the board.
- K: ground
- A: with variable resistor connected to 5V. Similar to V0 controls the background led brightness. Can also be replaced by a fixed resistor.
Code
The sources can be found as an example project within all the sources from the book on GitHub.
It all starts with a request to the OpenWeatherMap API to receive the forecast for a specific location.
public static String getForecast(String location, String appId) {
    StringBuilder rt = new StringBuilder();

    try {
        URL url = new URL("http://api.openweathermap.org/data/2.5/weather"
                + "?units=metric"
                + "&q=" + location
                + "&appid=" + appId);

        HttpURLConnection conn = (HttpURLConnection) url.openConnection();
        conn.setRequestMethod("GET");

        int responseCode = conn.getResponseCode();
        if (responseCode == HttpURLConnection.HTTP_OK) {
            BufferedReader in = new BufferedReader(
                    new InputStreamReader(conn.getInputStream()));
            String readLine;
            while ((readLine = in.readLine()) != null) {
                rt.append(readLine);
            }
            in.close();
        } else {
            System.err.println("Wrong response code: " + responseCode);
        }
    } catch (Exception ex) {
        System.err.println("Request error: " + ex.getMessage());
    }
    return rt.toString();
}
By using jackson.databind we can convert the received Json from OpenWeatherMap to Java objects.
{
    "coord":{
        "lon":3.02,
        "lat":50.9
    },
    "weather":[
        {
            "id":803,
            "main":"Clouds",
            "description":"broken clouds",
            "icon":"04d"
        }
    ],
    "base":"stations",
    "main":{
        "temp":6.16,
        "feels_like":3.05,
        "temp_min":3.89,
        "temp_max":7.78,
        "pressure":1032,
        "humidity":87
    },
    ...
    "name":"Passchendaele",
    "cod":200
}
Each part of the Json data is parsed by a separate class in the example application. For example the description:
package be.webtechie.pi4jgpio.weather.data;

import com.fasterxml.jackson.annotation.JsonProperty;

public class WeatherDescription {
    @JsonProperty("id")
    public long id;

    @JsonProperty("main")
    public String main;

    @JsonProperty("description")
    public String description;

    @JsonProperty("icon")
    public String icon;
}
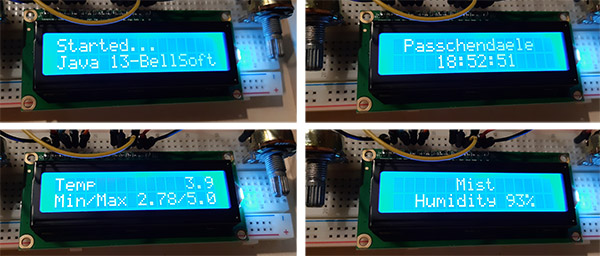
Once we have the Forecast object, it becomes very easy to display this on the LCD.
private void showTemperatures() {
    System.out.println("Showing temperature " + forecast.weatherInfo.temperature);

    try {
        lcd.clear();
        Thread.sleep(1000);

        lcd.write(LCD_ROW_1, "Temp",
            LCDTextAlignment.ALIGN_LEFT);
        lcd.write(LCD_ROW_1, String.valueOf(forecast.weatherInfo.temperature),
            LCDTextAlignment.ALIGN_RIGHT);
        lcd.write(LCD_ROW_2, "Min/Max "
            + String.valueOf(forecast.weatherInfo.temperatureMinimum)
            + "/"
            + String.valueOf(forecast.weatherInfo.temperatureMaximum),
            LCDTextAlignment.ALIGN_CENTER);
    } catch (Exception ex) {
        System.err.println("Error while handling content for the LCD: "
            + ex.getMessage());
    }
}
The full code is available in the GitHub repository and fully described in the book, including unit tests to validate the forecast request and parsing work as required.
Result
Conclusion
For this example I wanted to show you how easy it is to get data from a public source and show it on the LCD. Of course you could also show a sensor measurement or a database value or … Again, your imagination is the only limit!