Device monitoring tool with JavaFX, FXGL and Mosquitto
Original post on foojay.io — a place for friends of OpenJDK
In a previous post “Getting Started with FXGL Game Development” we already have taken a look at the FXGL game development framework developed by Almas Baimagambetov.
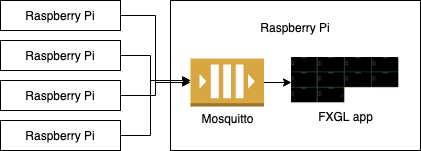
But, this game engine can also be used for other use cases. In this post, we will be building a system monitoring dashboard, which can run on a Raspberry Pi. The dashboard can be used to keep an eye on any device that can report its state to a queue. And, for me personally, it finally solves the problem of finding the IP addresses of all my Raspberry Pi’s when my router decided to shuffle them… ;-)
This post and code have a lot of contributions by Almas.
Application Description
A proof-of-concept has been set up using one Raspberry Pi as the “central system” to host the queue (Mosquitto). On this Raspberry Pi and others, a Python script runs to send the device state every second to the queue. For every new device (determined by the IP address) that appears in the list, a new dashboard “tile” is created to show some of the data. By clicking on this tile, we can enlarge the tile view to incorporate all of the data being received.
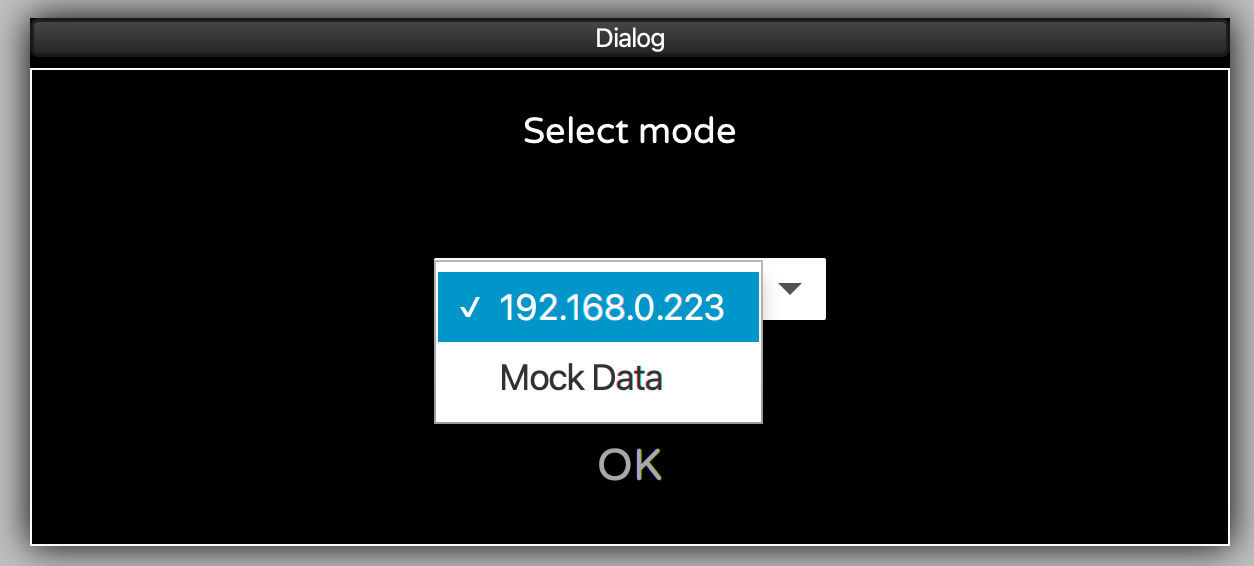
When the application starts, you can choose between “Mock Data”, or an IP address of the board with the queue. This video shows the mocked result:
The sources of this project are available on GitHub in the FXGLSystemMonitoring repository.
Mosquitto
Eclipse Mosquitto is an open-source message broker that implements the MQTT protocol which is lightweight and is suitable for use on all devices from low power single board computers to full servers. As such, it’s a perfect match to use on the Raspberry Pi.
Installing Mosquitto on the Raspberry Pi
Installing Mosquitto can be done with the following commands, which will also configure it as a service to start whenever your Raspberry Pi is (re)powered.
$ sudo apt update
$ sudo apt install -y mosquitto mosquitto-clients
$ sudo systemctl enable mosquitto.service
We can check if it is installed correctly and running by requesting the version:
$ mosquitto -v
1569780732: mosquitto version 1.5.7 starting
1569780732: Using default config.
1569780732: Opening ipv4 listen socket on port 1883.
1569780732: Error: Address already in use
The last line with the error message can be ignored.
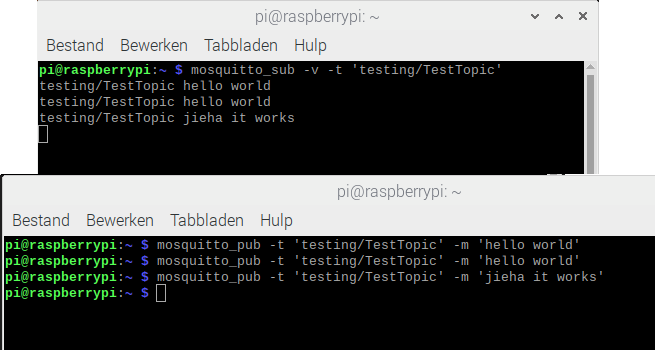
Testing Mosquitto on the Pi
The installed mosquitto-clients can be used to easily test if Mosquitto is running OK on the Pi, by opening two terminal windows. In the first one we start a listener on topic “testing/TestTopic”:
$ mosquitto_sub -v -t 'testing/TestTopic'
In the second terminal we send multiple commands with a message for this specific topic, like this:
$ mosquitto_pub -t 'testing/TestTopic' -m 'hello world'
$ mosquitto_pub -t 'testing/TestTopic' -m 'hello world'
$ mosquitto_pub -t 'testing/TestTopic' -m 'jieha it works'
Every “publish” from the second terminal window will appear in the first one as you can see in these screenshots:
Send State from Raspberry Pi
To send the state from all our Raspberry Pi-boards to Mosquitto, a script is available in the GitHub project . For this script, we are using Python as we only need some minimal example data which is easily available with the " psutil" library. Of course the same could be done with Java, but let’s embrace Python for once ;-)
Extra Dependencies
If you started from the default Raspberry Pi OS, Python is already installed. So we only need to add two extra libraries with the pip-command to send data to the queue (with paho) and get device status info (with psutil).
pip install paho-mqtt
pip install psutil
In this example we are only using a subset of all the data which is available from psutil to show as a proof-of-concept. A full overview is available on pypi.org/project/psutil.
A small part of the Python code shows how the virtual memory info is used to construct a json-message:
virtual = psutil.virtual_memory()

jsonString = "{"
...
jsonString += " 'virtual_memory': {"
jsonString += "   'total':'" + str(virtual.total) + "',"
jsonString += "   'available':'" + str(virtual.available) + "',"
jsonString += "   'used':'" + str(virtual.used) + "',"
jsonString += "   'free':'" + str(virtual.free) + "',"
jsonString += "   'percent':'" + str(virtual.percent) + "'"
jsonString += " },"
...
jsonString = "}"
With the paho-library we can send such a message to the queue with:
client = paho.Client(hostname + ":" + str(address))
client.connect(mosquitto)
client.publish(topicName, jsonString)
Inside the Monitoring Application
The application starts in MonitorApp which extends an FXGL GameApplication.
The Java/JavaFX/FXGL Maven project is organized in data-, queue- and view-packages to make the code easy to understand. Besides the expected FXGL-specific overrides (initSettings, initGame), we can find some nice examples of the additional features FXGL provides.
For example the dialog box at start-up asks the user to select mock or real mode:
runOnce(() -> {
    var choiceBox = getUIFactoryService().newChoiceBox(
            FXCollections.observableArrayList("192.168.0.223", "Mock Data")
    );
    choiceBox.getSelectionModel().selectFirst();

    var btnOK = getUIFactoryService().newButton("OK");
    btnOK.setOnAction(e -> {
        var result = choiceBox.getSelectionModel().getSelectedItem();
        if ("Mock Data".equals(result)) {
            startWithMockData();
        } else {
            getExecutor().startAsync(() -> startWithClient(result));
        }
    });

    getDialogService().showBox("Select mode", choiceBox, btnOK);
}, Duration.seconds(0.01));
Another one is the run() method which, every second, runs the provided code. In this case, the code generates random
data for the “mock” mode using Perlin noise:
run(() -> monitors.forEach(m -> {
    var t = random(0.5, 150000.0);

    var reading = new Reading(
            noise1D(t * 7) * 100,
            (long) (noise1D((t + 1000) * 2) * 40),
            (long) (noise1D((t + 3000) * 3) * 75)
    );

    m.onReading(reading);
}), DATA_UPDATE_FREQUENCY);
Incoming data
By using JSONB the incoming data is converted to Java objects. For example, let’s look at the VirtualMemory class
which maps the Python data to a Java object. Each JsonbProperty has a name-value which is not required if the variable
has the same name, but for clarity, I prefer to still define it to avoid errors later when the Java variable is renamed.
public class VirtualMemory {
    @JsonbProperty("total")
    private long total;

    @JsonbProperty("available")
    private long available;

    @JsonbProperty("used")
    private long used;

    @JsonbProperty("free")
    private long free;

    @JsonbProperty("percent")
    private double percent;

    public VirtualMemory() {
        // NOP needed for JSON mapping
    }

    // Getters - Setters
}
Qeueu
By using the “org.eclipse.paho.client.mqttv3” dependency, we can easily connect to the queue:
MqttClient client = new MqttClient("tcp://" + ipAddress + ":1883", MqttClient.generateClientId());
client.setCallback(new ClientCallback(readings));
client.subscribe(topicName);
The ClientCallBack gets called each time a message is available for the topic that we mentioned earlier.
@Override
public void messageArrived(String s, MqttMessage mqttMessage) {
    String data = new String(mqttMessage.getPayload());
    System.out.println("Message received: " + data);
}
The view components
All the views are split into separate JavaFX Nodes. The overall MonitorView is responsible for handling both
the CollapsedView and the ExpandedView, which in turn delegate their responsibility to LoadView
and CanvasLineChart respectively. An illustrative example of these relationships is provided below:
App uses MonitorView

MonitorView uses CollapsedView and ExpandedView

CollapsedView uses LoadView

ExpandedView uses CanvasLineChart
All these views implement the ReadingHandler callback, which notifies each view when a new reading from the queue is
available. Therefore, all views can easily be updated following this notification.
Animations
Each dashboard tile expands on click to fill the entire window. This expansion happens as an animation, which seamlessly
transforms the CollapsedView into the ExpandedView. The animation itself makes use of the FXGL animation system
using “fluent” API, where we can configure various properties, such as duration and interpolation. We also provide the
JavaFX observable property that we are animating (bg.widthProperty()) and the values at the start and end of the
animation:
animationBuilder()
        .duration(ANIMATION_DURATION)
        .interpolator(Interpolators.EXPONENTIAL.EASE_OUT())
        .animate(bg.widthProperty())
        .from(MONITOR_WIDTH)
        .to(APP_WIDTH)
        .buildAndPlay();
Running the Application with Mock Data
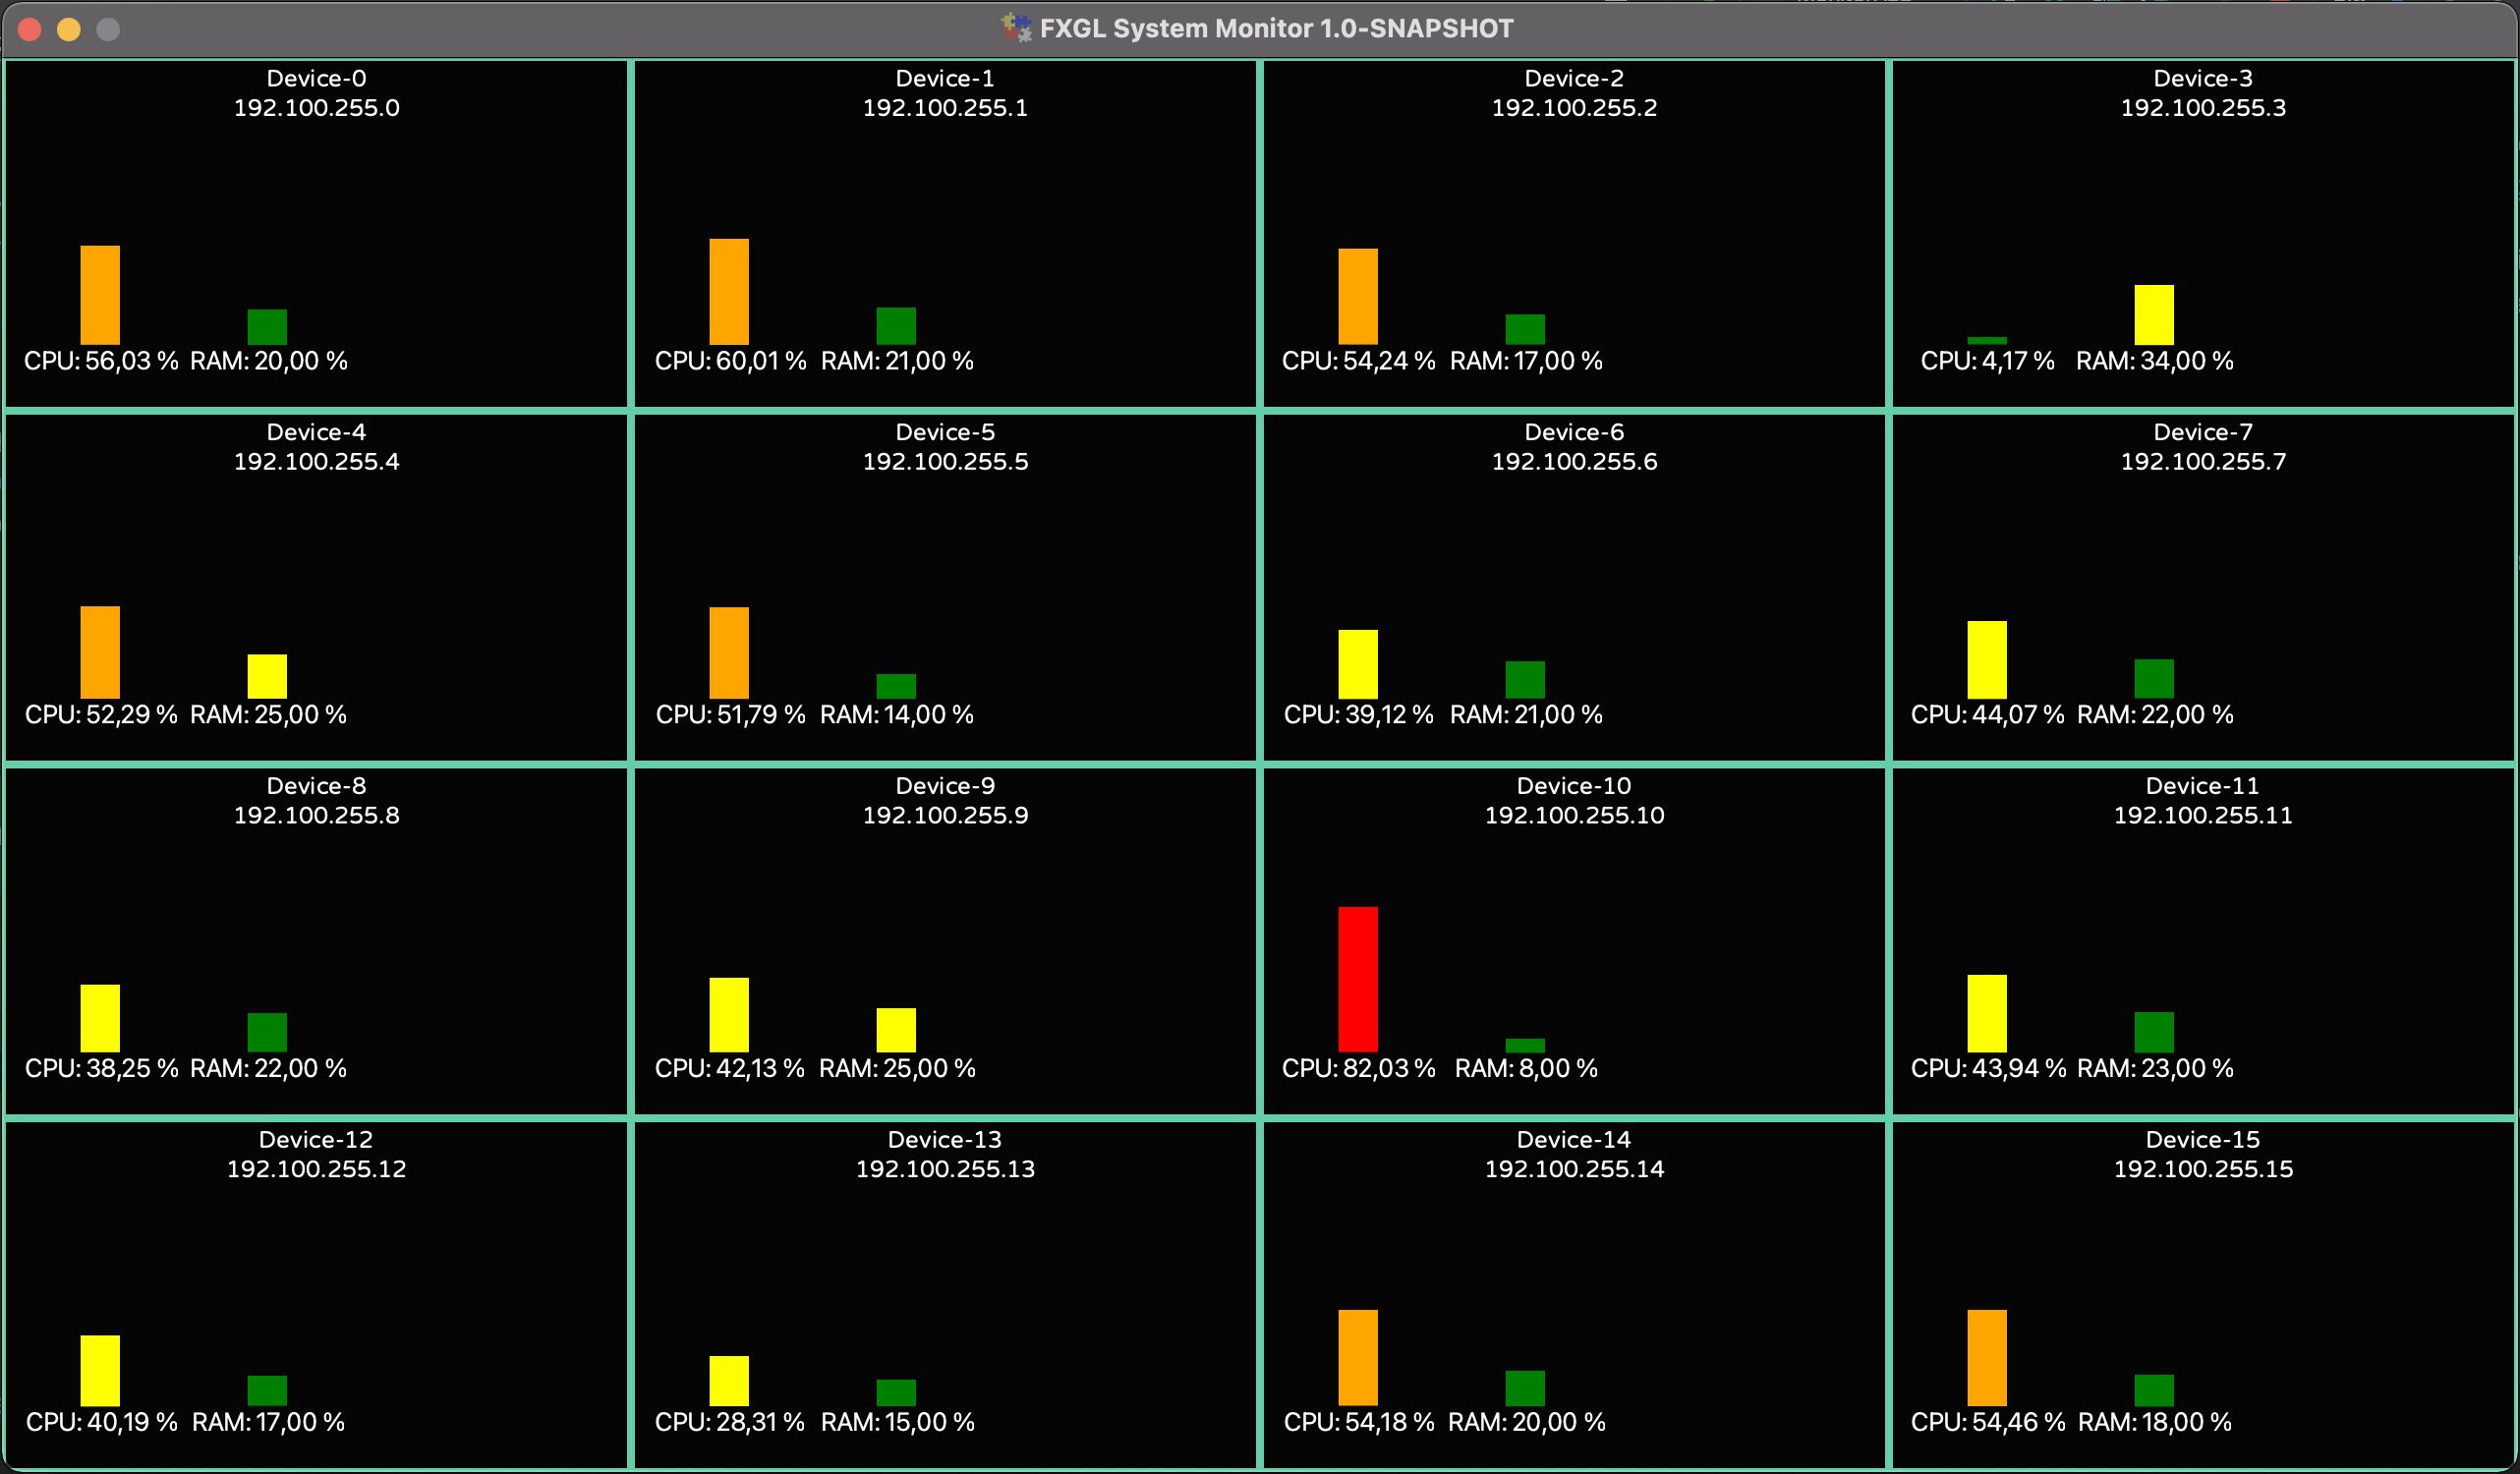
When the application starts, you have the choice to select between an IP address of the Raspberry Pi with the Mosquitto queue and “Mock Data”. After selecting this second option, 16 devices will be created inside the application, where each device is driven by the randomly generated data. This is ideal for testing all of the application functions.
Running the application with real data
Restart the application and select the IP address. As soon as data is received from a device with a new IP address, a new tile is created to visualize the data. Start the Python script on a few devices to see the result as shown in the video below.
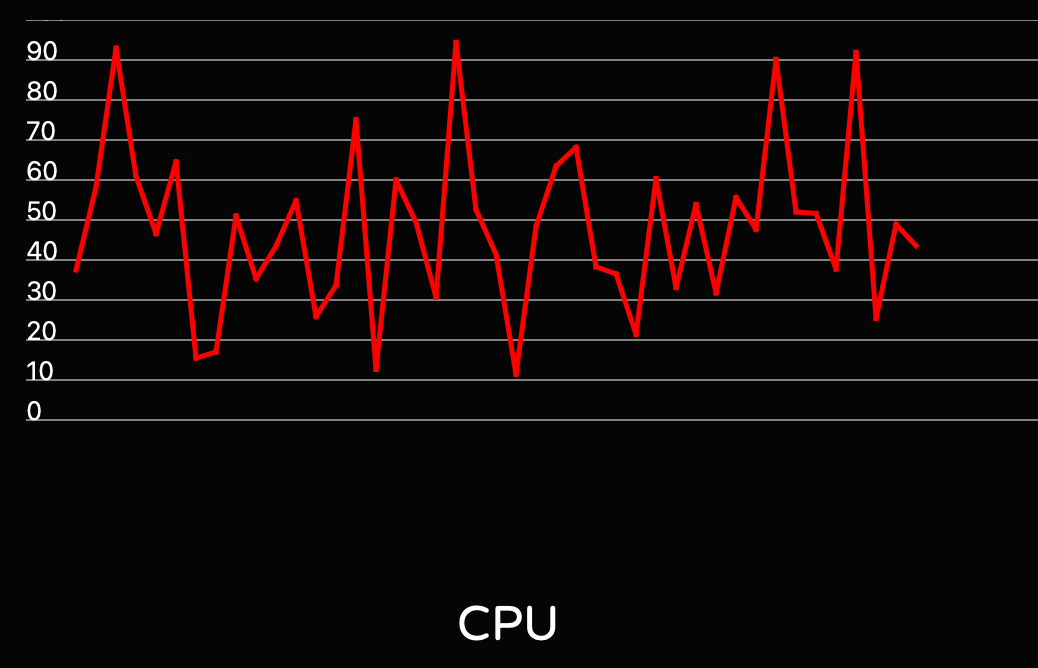
As you can see in the video, my Pi’s are not very busy. By using the stress-tool we can trigger additional load on the device to test the visualization in our dashboard.
On my Raspberry Pi (B4 8Gb memory) the cpu-command only impacts the CPU value, while the vm-command causes both higher CPU and memory usage.
$ sudo apt install stress
$ stress --cpu 2
$ stress --vm 4 --vm-bytes 1024M
Conclusion
It should be noted that something similar could be done with the magnificent TilesFX library by Gerrit Grunwald but we deliberately took another approach to show you how you can create visualization components with JavaFX and FXGL yourself. Combined with the right libraries for JsonB and Paho, Java proves, yet again, that very powerful applications can be created with minimal code which is easy to read and extend.
As this is just a proof-of-concept, there is still a lot of room for improvement… Just a few ideas:
- Indicate devices that haven’t sent data in the last X seconds and turn the view background to red
- Combine multiple values on the chart
- Provide additional info inside the expanded view
- Add a dialog asking the user for the queue IP address
Feel free to use this project as a starting point or as an inspiration, but please share what you have created!